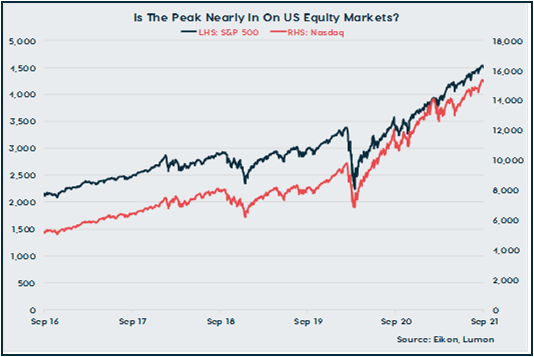
Equities have come under some downward pressure over the past week, which has prompted some analysts to suggest that we may be on the cusp of a correction (usually defined as a drop of circa 10%). Investors have entered this month particularly skittish. Indeed, per a Reuters survey of 250 equity markets strategists from end-August, the consensus view is for the S&P 500 to fall by 8% by end-year. We are not best placed to judge whether a pullback is coming, but we have noted that equities have tended to sell-off around mid-month in the lead-up to what is known as ‘Options Expiration’ date, which appears to be a function of traders’ hedging activity. It may be the case that last week’s action was a result of traders attempting to front-run these developments.
That said, equity valuations certainly appear fairly frothy, with the S&P 500 up by 19.6% in the year-to-date and 32.2% year-on-year. The initial strong rebound following the onset of the crisis was attributed to the fact that interest rates were likely to remain at rock bottom for an extended period, with markets at this time last year anticipating that we wouldn’t see the Bank of England, European Central Bank or the Fed hike interest rates until the middle of the decade. The prospect of a ’lower for longer’ interest rate environment was based on the assumption that the rebound from the pandemic would be sluggish, with investors taking their cues from the post-Global Financial Crisis period.
As vaccines became available, it became clear that a strong economic rebound was coming this year, with markets pricing in earlier and earlier interest rate hikes as GDP forecasts were revised up in Q121. Equities, however, were relatively unphased and continued to push higher as the narrative instead shifted to one that strength in earnings growth as households released pent-up demand and governments kept the fiscal taps running would help to offset the rise in interest rates.
This argument has also now come under threat, however, as growth has eased as the pandemic has proven more persistent than anticipated and significant supply chain disruptions have emerged. Meanwhile, the prospect of near-term monetary policy tightening has arguably increased, with central banks having tentatively started to signal that they are worried about second order effects on inflation stemming from labour and materials shortages.
Against this backdrop, it is difficult to imagine a situation where we don’t see a modest pullback on equity markets. In and of itself, this is nothing to be feared and we note that pullbacks on the order of 5-10% typically occur roughly 2-3 times per year. The absence of such a pullback this year is a bit of a historical anomaly as a result. The big question, however, is whether we are in a bubble and if we may be on the cusp of a significantly larger fall.
Unfortunately, economists have generally struggled to come up with a convincing theory of why bubbles form, reflecting our view that on average individuals are rational. However, recent research from two economists from Queen’s University Belfast has attracted much attention on this front. The authors use a fire triangle to characterise bubbles, which appears to match current conditions closely. Credit growth represents fuel (interest rates are currently at rock bottom & margin debt is close to record highs), marketability represents oxygen (retail investors have ploughed into equity markets as commissions & trading fees have been slashed), speculation represents heat (investors have bought every dip and prevented more pronounced pullbacks, based on the assumption that equities can only move higher) and technology represents a spark (belief in a forthcoming productivity boom has boosted tech stock in particular).
If this is a bubble and it does pop (either this month or further along the line), what does this mean for currency markets? The immediate response is likely to be a flight to quality, with the yen and the Swiss franc benefitting. On the face of it, the dollar should also attract some support, though given the likely US-centric nature of any crisis this may not be sustained. Indeed, following the popping of the Dotcom bubble in the early 00s the dollar came under sustained pressure as the US economy entered recession, with the US Dollar Index remaining on a sustained down trend as capital inflows dried up and dropped by 33% by 2005. We’re unlikely to get an answer by the end of this week, but developments in equity markets will bear close watching over the coming weeks.
The Week Ahead
UK
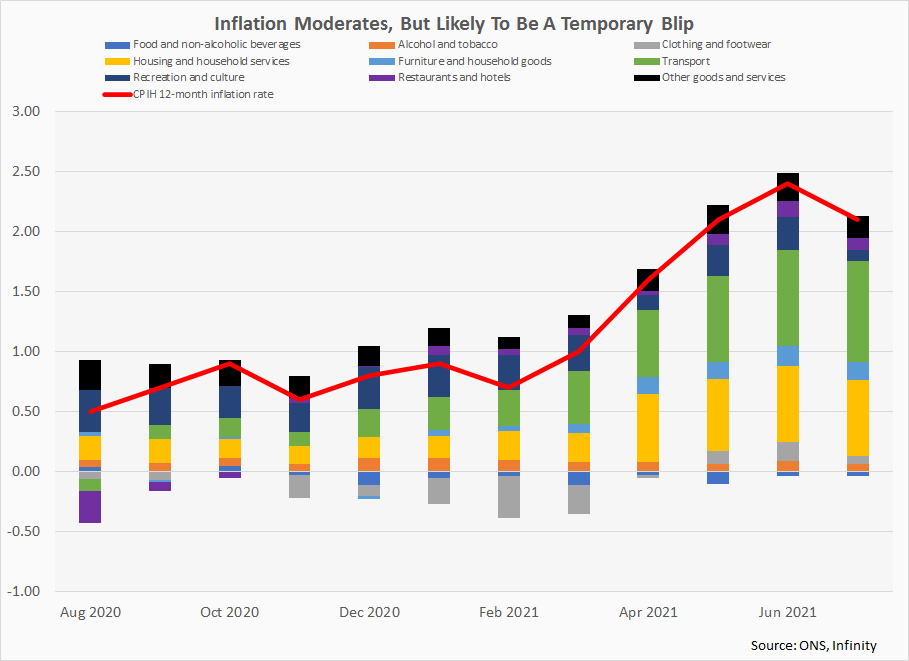
The focus on this side of the Atlantic this week will be on the August print of UK CPI. Inflation is projected to have soared to 2.9% on a y-o-y basis from 2.0%, which to a large degree will reflect base effects associated with the rebound in energy prices and last year’s Eat Out To Help Out scheme that depressed prices in the hospitality sector. The emergence of significant supply-side pressures related to transportation bottlenecks and work shortages that have coincided with a surge in pent-up demand following the conclusion of lockdown is also a key factor pushing prices higher.
This is likely to represent the first of a series of above-target inflation prints over the remainder of H221, with the Bank of England anticipating that it will peak in December at 4.0%. Risks to these projections are tilted to the upside, due to spiking gas prices and signs that worker shortages may prove more persistent than had been thought. This was flagged by a raft of BoE speakers last week, with officials pointing to a number of structural headwinds linked to reduced immigration (owing to Brexit and the pandemic) and a drop in the labour force participation rate (the pandemic has seen young people spend longer in university and those near the end of their careers retire earlier).
We will get an update on the employment situation this week as well, though the data remain distorted by the Job Retention Scheme. While technically the unemployment rate is likely to come in at circa 4.6% in the three months to July, data from HMRC suggest that 5.4% of the workforce were on furlough at the end of July despite the government removing the majority of restrictions on activity on July 19. We are optimistic on the outlook for the labour market post-furlough, but believe that the BoE’s forecast that the unemployment rate will not rise in October as potentially too optimistic. While job vacancies are at a record high, those who are on furlough may not have the skills to fill these positions, for instance, it is unlikely that out-of-work cabin crew workers will become HGV workers overnight.
US
As in the UK, the focus in the US this week will be on the release of CPI inflation figures for August. Price pressures are not expected to have eased significantly in the month, with the headline y-o-y rate forecast at 5.3% (5.4% in July). This is a result of the same sort of demand-supply imbalances that we are seeing in the UK, as well as energy price related base effects. The situation has been exacerbated in the case of the US by the size of the fiscal stimulus that the government unleashed in response to the crisis that saw the budget deficit soar from 4.7% of GDP in 2019 to 14.9% in 2020 and a projected 13.4% in 2021. Looking ahead, inflation is likely to ease somewhat as price growth in sectors most sensitive to the re-opening (hospitality, travel etc) begins to moderate. However, it is set to remain well above target as supply chain disruptions persist and wage inflation continues to print on the hot side (4.3% y-o-y in August).
Retail sales for August will also feature this week, which will be looked to for an insight into how consumer spending held up as the epidemiological situation deteriorated notably. Sales are forecast to have dipped by 1.0% m-o-m, though the sharp fall in consumer sentiment in the month poses some clear downside risk to this projection. On that note, it will be interesting to see whether the flash estimate of the University of Michigan measure of sentiment rebounded at all in September, though this seems unlikely as the current Covid wave is only now showing signs of having peaked and as federally enhanced jobless benefits were allowed to expire on September 6.
Eurozone
The eurozone calendar has a quiet look to it, with industrial production figures for July the only item of any interest. Previously released national data suggest output removed modestly higher in the month.
This blog post is intended to provide you with information on the services Lumon Pay Ltd (“LPL”) offer and should not be interpreted as advice or as a solicitation to offer to buy or sell any currency or as a recommendation to trade. Foreign exchange rates provided therein are for indicative purposes only and are not intended to give an accurate reflection of current currency exchange rates or to predict future movements in currency exchange rates. LPL, trading as Lumon, is a company registered in England with its registered address at Building 1, Chalfont Park, Gerrards Cross, Buckinghamshire SL9 0BG. LPL is authorised by the Financial Conduct Authority as an Electronic Money Institution (FRN: 902022).